How to use HuTime (Outline)
This page provides simple explanations on how to use HuTime. Please see the operation manual for detailed information.
1. Data Creation
How to make CSV file
HuTime data can be easily created from CSV files written using MS-Excel.
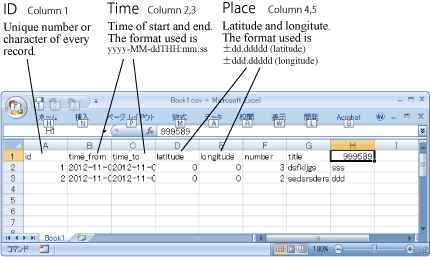
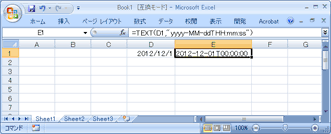
Data items in the five leading columns are fixed (Fig 1-1). Time data must be expressed in the fixed format (yyyy-MM-ddTHH:mm:ss). In MS-Excel, data can be formatted in this manner using the following formula:
TEXT([Cell Number],"yyyy-MM-ddTHH:mm:ss")
(Fig 1-2). Data fields in column 4 and 5 can be left empty.
Contents of column 6 and later will differ depending on the imported data type.
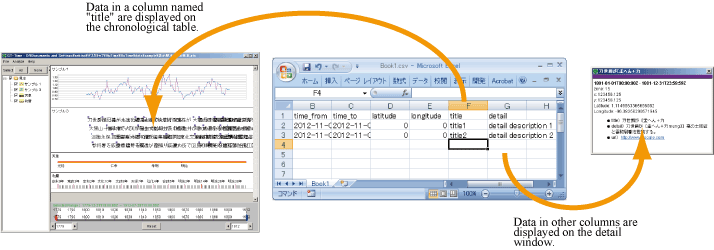
Chronological table character data: Data in a column named "title" (written as "title" in the leading row) is displayed on the imported chronological table. Data in other columns are displayed in the detail window with the column names (Fig 1-3).
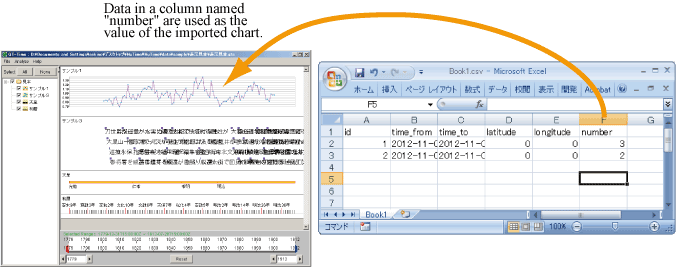
Numerical data for chart: Data in a column named "number" (written as "number" in the leading row) is used as the value of the imported chart (Fig 1-4).
Template files for character and numerical data are available.
CSV template files for character data (chronological table) download
CSV template files for numerical data (line, bar and plot chats) download
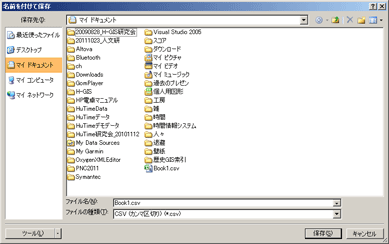
Saving CSV FileSave the created worksheet by clicking "Save As", and then selecting "CSV (comma separated) *.csv" for the file type (Fig 1-5).
When the CSV file includes non-alphanumeric characters, UTF-8 character encoding must be used. Please convert the character encoding using Notepad by following the procedure below:
1) Right click the CSV file, and select "Notepad" in the "open from program" menu.
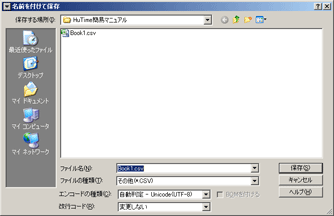
2) Select "Save As" in the "File" menu and change the character encode to "UTF-8" (Fig 1-6).
3) Click the save button to save the file.
Caution: This converted file cannot be edited directly from MS-Excel. If it is necessary to edit the original file, it must first be saved with a different name.
2. Data Import to HuTime
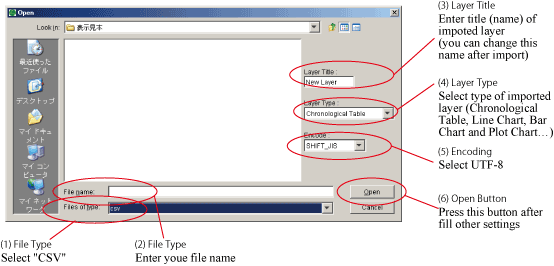
Start HuTime and select File > Import > Layer, to display the file "open" window (Fig 2-1). Set the required data in the window, and then press the "open" button.
3. HuTime data display
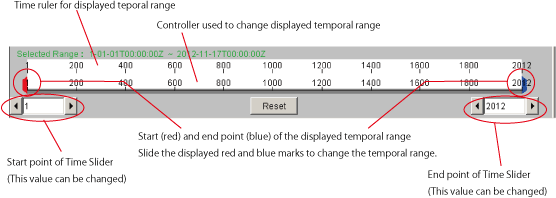
In HuTime, the imported data is displayed on the main panel as a layer. You can move, expand, and shrink the displayed temporal range (Fig 3-1).
4. Data Search in HuTime
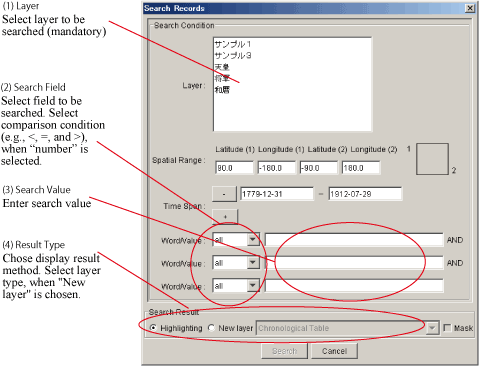
Select Analyze > Search from the menu to display the Search window (Fig 4-1). The Search result can be shown in a new layer, or in the current layer with record highlight. When more than two layers are selected for the search and "new layer" is chosen as the result type, the result will be gathered into a new layer.


