What can we do using HuTime?
This page introduces a number of HuTime’s typical functions. Detailed operations and other functions are explained in the operation manual.
Chronological tables and charts with scalable temporal axes
Using the geographic information system (GIS), users can move, expand, or shrink the displayed spatial range of a map. Similarly, with HuTime, users can move, expand, and shrink the displayed temporal range. This function enables researchers to create chronological tables and charts that include events over various time spans, from periods as short as a single day or hour, to periods as long as a year or century. Thus, users can examine the loaded data in its entirety using the expanded displayed temporal range, and gain an understanding of the times when event information is concentrated or when drastic changes occur. From that point, the user can shrink the displayed temporal range to investigate the details of various events in the most relevant periods.
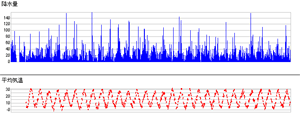
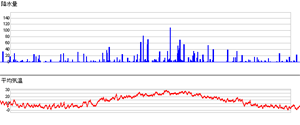
Daily changes in precipitation and air temperature: (left) long-term trends over 20 years, (right) short-term trends during a single year.
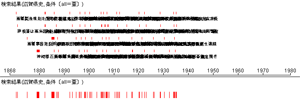
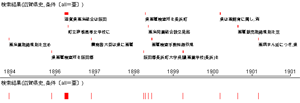
Silkworm related events described in "The History of Shiga Prefecture": (left) events over a 100-year period. Users can quickly grasp that there were no silkworm-related events from 1945, (center) events in late 1890s, (right) and details of an event displayed in another window.
Time Slider: interface used to select the displayed temporal range.
Various expressions
The most unique feature of HuTime is a function that allows users to display various types of data on the same temporal axis. With this feature, HuTime can express character and numerical data as a chronological tables and time series charts (line, bar, or plot charts), respectively. These different expression types are then displayed on the same temporal axis in a panel. This function enables users to consider relationships between numerical data, such as economic or meteorological information, and character data, such as historical information.
The original time ruler created by the user is another unique HuTime feature. With it, users can apply the specific calendar systems used in particular eras to their historical studies. In the same fashion, they can apply the time ruler to show rainy/dry seasons and the lunar cycle to their studies into agriculture and fishery, respectively.
Chronological table search and reconstruction
HuTime can locate and extract events that satisfy a certain search condition from one or more chronological tables. This search result can then be shown as a new chronological table. Thus, users can construct a dedicated chronological table about a specific subject by mining other chronological tables as data sources. This function corresponds to the GIS merge function.
Information analysis based on time data
GIS includes a function that can be used to create specific rectangles or polygons that satisfy particular conditions. Similarly, using HuTime, users can create specific data called "Masks" to show temporal ranges that match specific conditions. More specifically, users can create a mask from character data, such as a temporal range of events based on keywords (e.g., events in a time span that include of the word "War"), or from numerical data, such as a temporal range with specific condition (e.g., days with more than 10 mm precipitation). Additionally, via a logical operation, users can create new masks from two or more previously created masks (which corresponds to the union and intersect functions in GIS) and can then extract any events that are overlapped by the temporal range shown in the new mask (which corresponds to the clipping function in GIS).
What operations are impossible with HuTime?
There are some functions that are difficult to implement, or that are unsuitable for HuTime, even though they may be desired by users.
Cyclic event analysis
Cyclic event is an important feature of time. Analysis of cyclic event include function to find cycle (ex. Fourier analysis) and to display events along the cycle. Unfortunately, HuTime of the current version does not have these function, though implementation of these function is expected in the feature. The function of original time ruler can partially realize the function to display events along the cycle, when ticks of the ruler are marked according the cycle.
Expert analysis
HuTime does not support expert statistic analysis processes such as multivariate and complicated time series analysis. One simple solution to such problems is for users to conduct such analyses using other software specialized for statistics using exported data from HuTime. Another potential solution, that is expected to be available in the future, involves adding an expert statistical analysis function to HuTime via the application’s plug-in feature.
Map Display
Although temporal and spatial information are closely related, HuTime cannot display maps, because the program was specially created to visualize and analyze temporal information. While map information can be displayed in GIS, information without spatial information (such as latitude and longitude) cannot be displayed in map form. On the other hand, there are often cases where a great deal of temporal information is available that cannot be referenced to a spatial context. World War II and Great Depression events are good examples of information that is available without spatial context (i.e., the period of the event can be determined but their precise location cannot be determined). When users need to display information on a map, they have the option of exporting HuTime data to any GIS software application.
As a tool for basic research
Even though HuTime can visualize and analyze various types of data along a temporal axis, the program is not designed to handle expert and/or complicated analyses. In other words, HuTime is not a universal tool. Instead, it is a "basic research" tool designed to assist researchers in defining and identifying subject matter from large and varied information sources, something that is especially valuable during initial research processes. HuTime shows its real worth when a researcher uses it in combination with other specialized software to accomplish a research objective.


