

Utilization Examples for HuTime
HuTime is used in various scientific fields. Some researches conducted using HuTime are introduced here. These examples will be a hint about what for and how to use HuTime.
Area Studies – Relationships among historical documents
Trade between Japan and Southeast Asia during the period from the Middle Ages to the early modern era was investigated using three historical documents (Rekidaihoan (歴代宝案, Precious Documents of Successive Generations), Tosen Yushutsunyuhinkiroku Suryoichiran (唐船輸出入品記録数量一覧, Quantity List of Imports and Exports Record by Tang Ships), Nagasaki no Toujinboueki (長崎の唐人貿易, Trade by Tang Merchants in Nagasaki)). Using HuTime, all the events recorded in those documents could be displayed along the same temporal axis. This made it possible to visualize what was imported into Japan during each period and how the political environment of the exporting countries affected regional commerce.
References
- 柴山 守 (2012) 地域情報マッピングからよむ東南アジア. 勉誠出版, 東京, 317pp.
- 柴山 守 (2012) HuTimeでよむ中世・近世近海アジア交流. HuTime/Mapを使った研究事例と将来展望, 2012年3月20日 H-GIS研究会 報告書, pp.1-6.
Similar utilization examples
Official documents of Ryukyu and Siam
National history comparisons
Environmental Studies – Relationships between monitoring data and documents
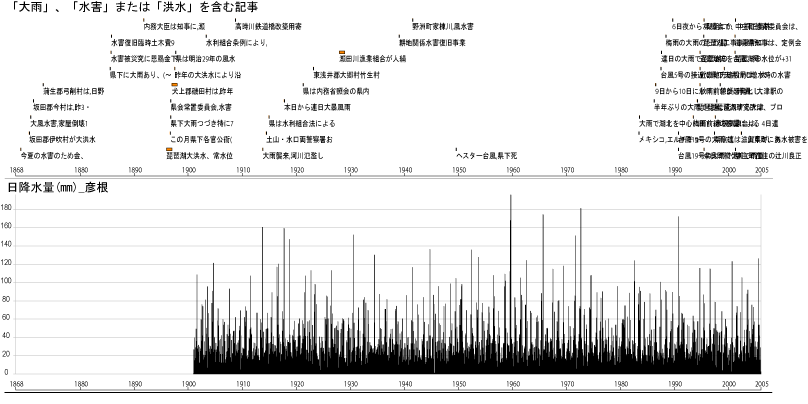
This study investigated how the prefectural government and public reacted to environmental changes and disasters in the Lake Biwa area of Shiga Prefecture, Japan. Using HuTime, the researcher visualized monitoring data related to water levels and quality, while displaying the proceedings of the Shiga Prefectural Assembly on the same temporal axis, even though these were different types of data. (For example, numerical and character data could be displayed in line charts and chronological tables, respectively.) This visualization enabled investigators to compare natural events in the lake to the assembly's reactions. HuTime was also used to identify events related to topics extracted from four chronological tables created by different organization. Those extracted events were then recombined into a new topic-based chronological table using HuTime.
References
- 関野 樹 (2010) 時間情報に基づく情報の収集と解析. 秋道智彌・小松和彦・中村康夫編 水と環境. 人と水. 勉誠出版, 東京都千代田区, pp.74-104.
- Sekino, Tatsuki (2009) An Experimental Information Analysis Based on Temporal Data: Water-level Fluctuation in Lake Biwa, Japan. Southeast Asian Studies 46(4) :593-607. (in Japanese with English abstract)
Similar utilization examples
Monitoring data and the assembly's reactions
Topics extracted from four chronological tables
Health Studies - Utilization for collection of research documents
During the course of an investigation by Japan's Research Institute for Humanity and Nature entitled "Environmental Change and Infectious Disease in Tropical Asia" HuTime was used to collect research documents about schistosomiasis (a parasitic disease) in China. The program allowed researchers to visualize the described periods of each collected document, which then helped researchers locate previously uncollected documents and determine the most significant periods related to the subject.
References
Documents about schistosomiasis
Other Utilization Examples
Utilization for study
- Historiography – Visualization of Shoku Nihongi(続日本紀, Chronicles of Japan, Continued) on HuTime
- Demography
Classroom introduction and utilization
- Nara University
- Osaka City University
